
Ylinopeudet.com
Summary
Tracks and visualizes speeding incidents of buses in the HSL area
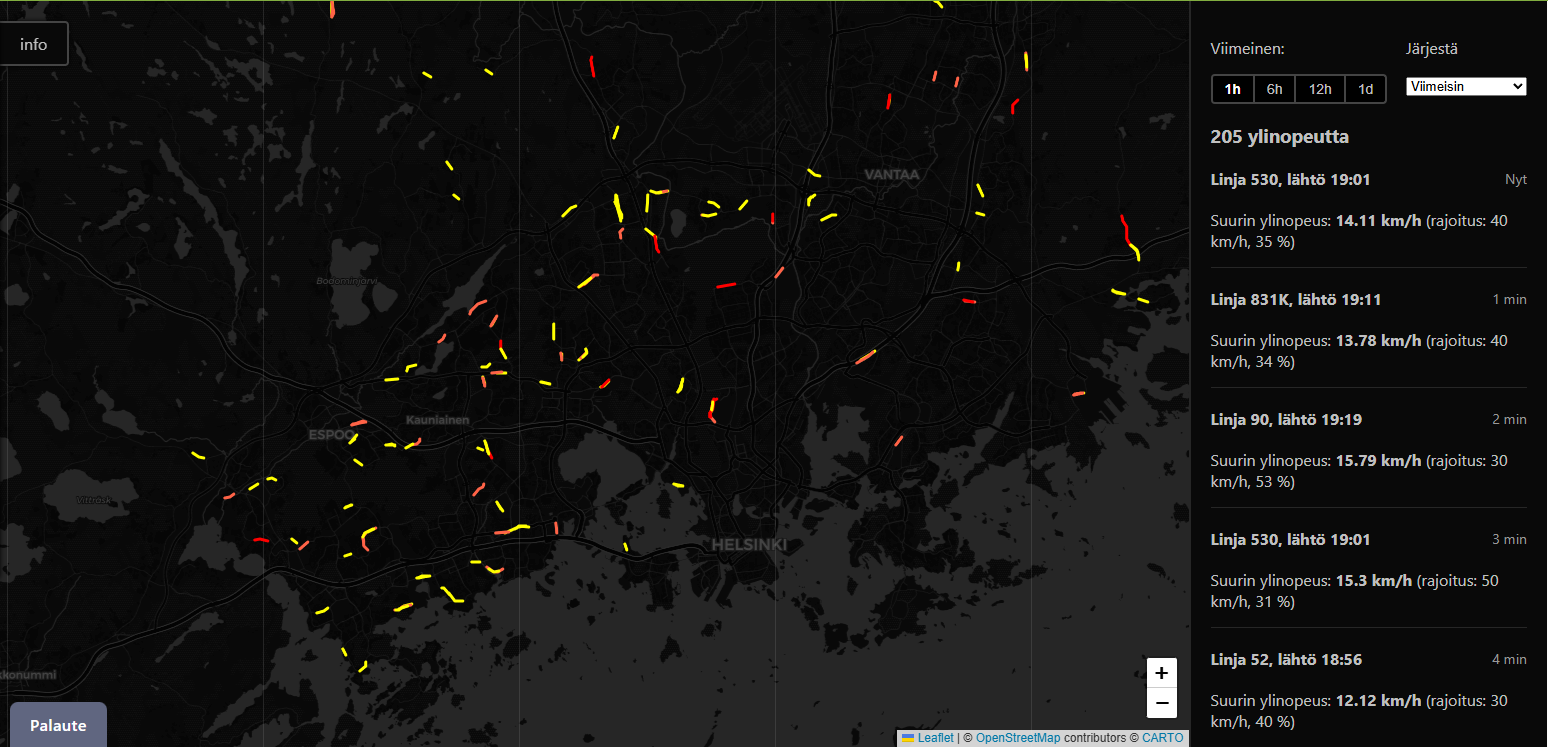
Ylinopeudet.com is a web app that tracks and visualizes speeding incidents of buses in the HSL area. When any bus exceeds the speed limit, it is marked on the map, allowing users to see real-time data about speeding incidents. The speeding incidents are also stored so that users can view speedings e.g. from the last hour, 12 hours or 24 hours.
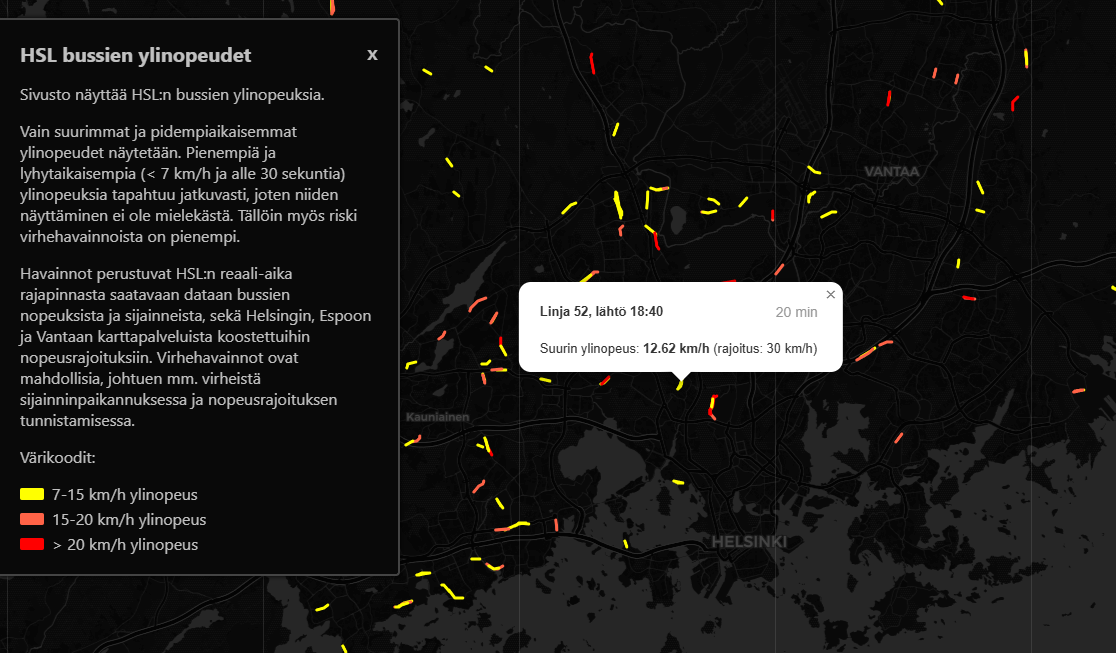
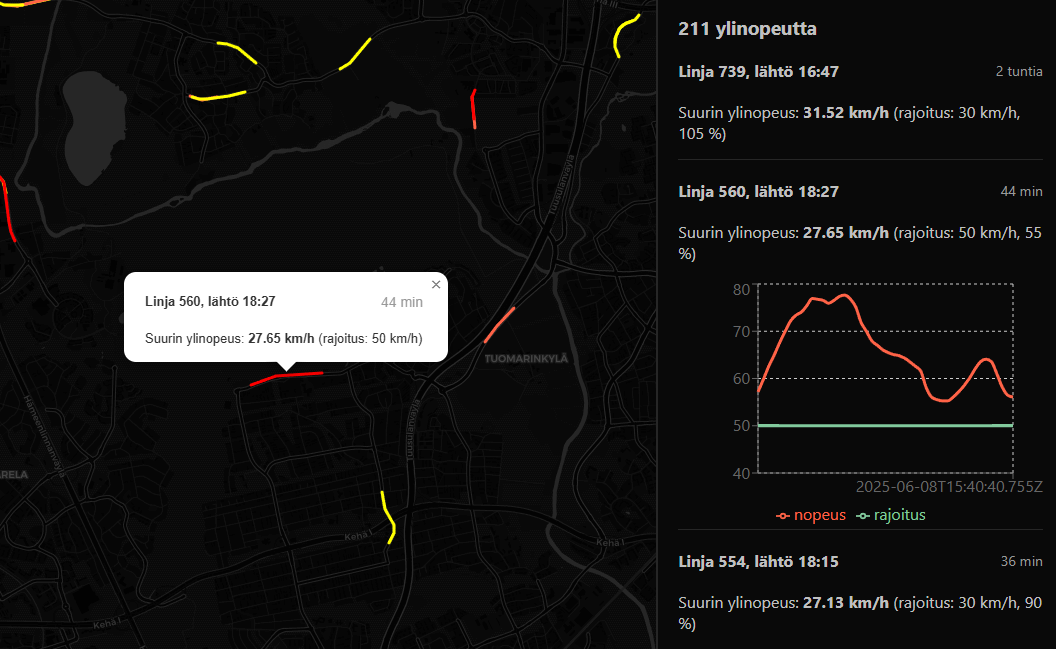
Speedings are visualized on a map, showing a color coded vector representing where the speeding happened and how much the speed limit was exceeded. For each incident, also a graph is shown to visualize the speed compared to the speed limit.
Screenshots
Background / Comments
I had seen a Twitter post about someone building a bot that posted speeding incidents of buses in the Tampere region around a specific school. From that I started exploring if that would be possible to do in Helsinki area too. I already knew about the open API that the bus company HSL provides, as I had built e.g. telegram bots to get notified about bus delays. After experimenting and exploring a bit, I found an API that provides real-time data about all vehicle positions and speeds.
I also wanted to expand the scope to track speeding incidents in the whole Helsinki metropolitan area, and not just for a specific school. To make that possible, I needed data about the speed limits in the region too, since the HSL API only provides the vehicle position and speed, but not the speed limit. I ended up having to do some work to clean and combine data from open datasets such as the OpenStreetMap and the open map services that the cities provide.
Tech
Architectually there are six pieces:
- API: Node.js, Express.js, Prisma, GeoJSON
- Database: Postgres
- Frontend: React, Tailwind
- Backend service for collecting data: Node.js, GeoJSON
The most important and interesting part is the backend service that handles collecting the data. That connects to the HSL real-time API, and then processes the data. Basically it receives data about the position and speed of every bus once a second, and compares that to the speed limit using GeoJSON. If the bus exceeds the speed limit during any tick, it then starts monitoring that to collect the whole path and speed. If the bus significantly exceeds the speed limit then the path and speed data is stored in the database.
Rest of the stack is basically for providing the data to the frontend and then visualizing it. All the speedings are stored in Postgres, and there is a simple API in frontend of that to handle serving and querying the data. The frontend then shows the speeding incidents on a map, and on a list, to easily visualize where, when and how severe the speeding incidents were.
Impact / Stats
There was some initial buzz around this when I released it, but I haven't had time to really market it / share it since. There is some traffic still coming from Google though. There has been around 1,000 visitors in total.
During building this, I noticed that the speed limits are exceeded almost constantly. To make the data collection meaningful I decided to only store and show incidents that exceed the speed limit significantly and for a longer period of time (over 7 km/h limit, for at least 30 seconds). Otherwise the whole map would be yellow basically.
One might think that professional drivers would respect the speed limits a bit more and e.g. timetables would be planned around speed limits, but the data shows that's not the case, which is definitely a bit disappointing.
In the future, it would be interesting to expand this further. For example, visualizing data from longer periods of time, to show e.g. on which streets / sections speeding is more common. Also it would be interesting to compare whether speeding is more common when the bus is already late from schedule.